Most incident reviews are limited to the same set of information: what happened, when it happened, and who all was involved. Sure, they provide satisfactory and essential answers to the first questions raised by the regulatory agencies and the board in charge of risk management oversight.
But they also leave much of the more complex matters largely unsolved.
Bow tie analysis pushes the review in both directions simultaneously, backward into causes and forward into consequences. It allows risk teams to compare incidents against one another and file each one away as part of a larger picture: why did it occur in the first place, and what did it actually trigger downstream?
What Is Bow Tie Analysis?
Bow tie analysis is a risk assessment technique that allows organisations to graphically depict cause-effect relationships in the form of a bow tie.
This technique was originally developed and used in the oil and gas sector because the risks there are some of the highest, with potential loss of life or environmental damage. Over the years, bow tie analysis found its way into other industries such as aviation, shipping, mining, chemical manufacturing, finance, and healthcare, among others.
The reason is simple: all of them deal with complex systems where it is paramount to understand what can cause a hazard and what consequences it may have. In other words, bow tie analysis is applicable to almost any risk or compliance issue that requires mapping cause-consequence scenarios.
The Structure of a Bow Tie Diagram
(Note for Qanaita: Please ask Anwer to recreate the following diagram according to Paragon’s brand guidelines.)
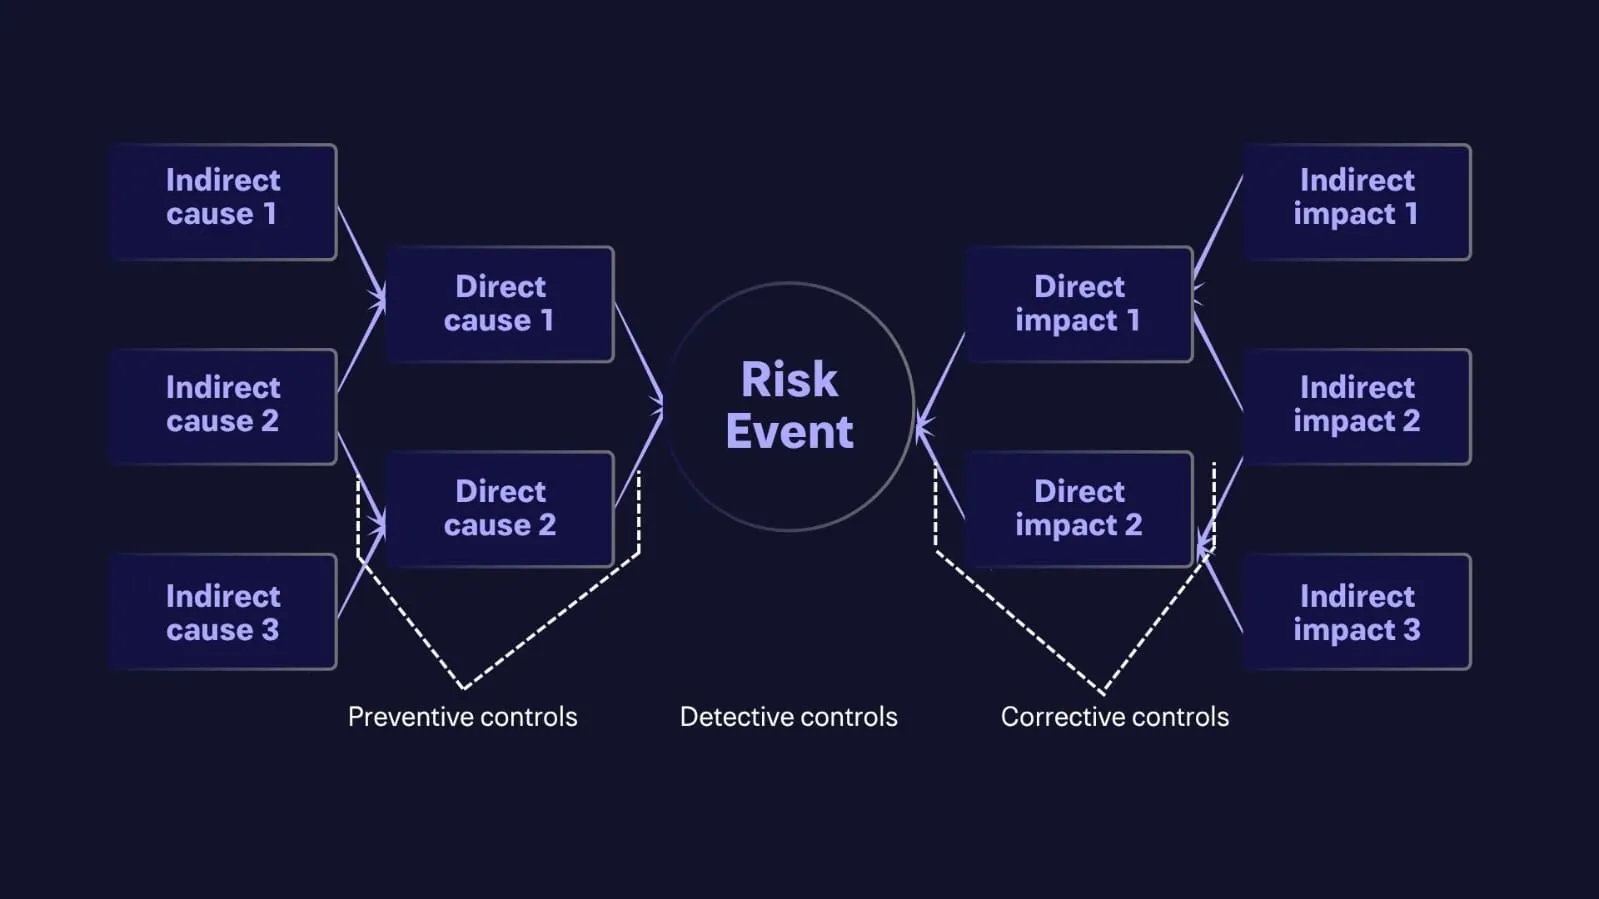
The risk event is in the middle of the bow tie, where the knot is. To the left are direct and indirect causes, with the former being closest to the knot. The indirect causes are “higher-level” events that trigger the direct ones, and can be determined by asking “why” in relation to the direct ones, and so on, until there are no causes remaining within the control of the organisation. Preventive controls are located to the left of direct causes and act as barriers that prevent the causes from triggering the risk event.
To the right of the risk event are direct and indirect consequences. Detective controls are placed closest to the risk event because how quickly the risk event is identified determines how severe the downstream consequences become.
Corrective controls, on the other hand, lie between the consequences and their indirect effects because they determine how much the consequences are contained or worsened.
Key Benefits of Bow Tie Analysis
- Visual clarity: A picture does indeed paint a thousand words, and a bow tie makes a set of causes and consequences easy to grasp at a glance by both specialists and nonspecialists alike, including the board of directors, who may have no understanding of the particular risk under review.
- A comprehensive overview: By displaying causes and then consequences, the bow tie brings to light any number of vulnerabilities in the bigger system, which a single incident can’t begin to show on its own.
- Control assessment: The exercise required to produce a bow tie lays bare which controls are fit for purpose and which are merely on the books.
- Accountability and prioritisation: The emphasis on particular controls makes it much easier to delegate responsibility to particular people or units.
- Better allocation of resources: A bow tie that lays out causes and consequences promotes spending on the most damaging risks rather than spreading out smaller amounts on everything.
- A risk-aware culture: A bow tie analysis reinforces risk management by helping the whole company develop an awareness of risk, from line workers dealing with the risk every day to the board of directors, who may only think about it once a year.
Bow Tie Analysis and Key Risk Indicators
The key risk indicators (KRIs) fall into different categories, depending on which side of the bow tie they relate to:
Cause-based KRIs
The cause-based KRIs relate to risk events’ precursors; they can be things like the number of hours worked by employees if their fatigue is identified as a potential risk factor.
Cause-based KRIs are usually associated with boxes on the left side of the bow tie: causes and their precursors. Any box that mentions a potential root cause or has been subjected to the “why” analysis to identify it can be a KRI candidate.
Failed preventive control KRIs
KRIs can also be derived from all failed preventive controls identified during the bow tie development. Most probably, they were the ones flagged as ineffectual during the bow tie analysis and, thus, represent the increased likelihood of a risk event.
They should be KRI candidates because, in many cases, there was no control preventing the risk event from happening. The preventive control KRIs are associated with the left side of the bow tie, the preventive controls zone.
Detection-time KRIs
These KRIs should be related to how quickly an event or its consequence can be detected. They are suitable for rapidly evolving risk scenarios, where time is of the essence. Detection-time-based KRIs are associated with the knot of the bow tie diagram, where the risk event is detected or becomes known.
Corrective control KRIs
KRIs related to the response to a risk event are connected to having appropriate backup systems, recovery sites, and procedures in place, as well as to communicating the necessary information to the relevant parties. They relate to the right side of the bow tie, and thus, can be used to evaluate responsive controls:
- Are the backups and alternate sites reliable?
- Do they function as designed?
- Are all the procedures followed correctly?
- Can communication be established?
Common Mistakes When Conducting Bow Tie Analysis
For all its strengths, a bow tie diagram can look thorough and still fail to fully represent the situation. You leave the exercise satisfied that the analysis has been completed thoroughly, only to find six months later that the same incident took you by surprise because the diagram did not capture the real problem the first time.
Most often, it’s not that the diagram itself isn’t so much flawed as it is incomplete, based on wrong assumptions, or had become outdated even after the organisation that surrounds it changed. It is far less expensive to identify these mistakes and correct them than to face the brunt of their consequences of the next incident.
1. Stopping the “Why” Chain Too Early
When teams start building the bow tie analysis, they tend to ask themselves why something happened, and stop when they reach the first reasonable-sounding answer.
But the fact remains that on most occasions, it is never the sole or even the main reason why something happened and the team could dig much deeper.
For instance, if an error occurred due to human activity, it seems plausible to assign a ‘human error’ as the cause of the incident. But the analysis shouldn’t end here. One needs to understand why the error was committed: was the procedure ambiguous or was the employee inadequately trained or was there a lack of control or excessive workload or inappropriate system design or insufficient access to required information?
Put simply, it is essential to continue asking ‘why’ until the point when it is possible to suggest a specific control or another action that could prevent the cause from occurring. Only then is it possible to say that the bow tie analysis has been done correctly and there is a reasonable understanding of the event’s causes. Otherwise, the analysis would only describe what happened, but not why it happened, which defeats its purpose.
2. Treating It as a One-Person Job
When one person makes the entire diagram without consulting those closest to the process, a bow tie analysis can easily become unfinished. It’s not uncommon for different stakeholders to perceive various threats, vulnerabilities, repercussions, and controls differently.
On the one hand, a compliance or technology specialist might spot a control weakness that is imperceptible from an operational standpoint, whereas on the other hand, someone in charge of operations might spot a threat that would never have occurred to a risk manager.
The analysis is, therefore, best done in a participative manner by a group of individuals involved in designing, operating, monitoring, and controlling the process under review. Their input helps challenge the assumptions made and exposes weaknesses that would have been overlooked on either side of the bow tie. This way, the final bow tie diagram is a comprehensive list of all the possible risks and their control measures.
3. Not Updating the Bow Tie Diagram
A bow tie analysis should be regarded as a living document that always evolves alongside the organisation’s operations as opposed to a singular, isolated event. The business world is always changing and as such, the risks to the business may increase or decrease with time.
Technology changes, regulations get updated, and the controls used to monitor and protect the business can become inadequate as circumstances shift. A new system introduced to withstand attacks needs to be added to the diagram. Likewise, a change in organisational structure can create new vulnerabilities and by extension, new points of failure. Controls that worked well under one set of circumstances may not hold up under a different one. The same applies to weaknesses in the system: new ones can appear, and old ones can become easier to exploit than they once were.
This is why the bow tie diagram should be reviewed and revised whenever there’s a major change to the process, risk environment, control regime, or business model, or whenever there’s a concern about the effectiveness of particular controls.
4. Only Focusing on the Left Side of the Bow Tie
When constructing a bow tie diagram, project teams often devote much of their attention to the left side, describing all possible causes and threats whilst also ignoring the effects and controls on the right.
In actuality, the right side of the bow tie has much significance and should be considered no less important than the left side, as it has just as much bearing on how severe the outcome of the event will be.
The bow tie’s right side determines how an organisation can detect an event that has already occurred or is currently taking place. Moreover, it defines what controls, if applied, can eliminate or at least mitigate the negative consequences of an event. For instance, in the case of a cyberattack, it might be impossible to completely eliminate each type of potential interference. But it is always possible to timely detect it, contain it, recover the system, and respond adequately to the event that has occurred. That’s exactly why it’s essential to thoroughly analyse and assess both sides of the bow tie, namely, how an organisation can prevent the first event and what it can do to respond to it in case prevention fails.
One Caveat, Though…
Causes, such as high staff turnover and unfilled vacancies, may not only directly increase the likelihood of an event occurring, but may also weaken the associated mitigating controls.
Causal factors may also exacerbate the severity of impacts when events do occur, e.g. fat-fingered typing errors are more financially consequential during periods of high volatility, rather than low volatility.
Causes may variously influence:
- The Occurrence of events;
- The effectiveness of Controls; and
- The Severity of losses
Time is also reflected as both:
- Duration: the time between the failure of the Preventive Controls and the success of a Detective Control; and
- Lags: the time between Detection and Settlement.
Therefore, it is important to take into these considerations when performing a bow-tie analysis, and in particular, the KRIs adopted as a result.
How Paragon Consulting Partners Can Help
Running a single bow tie diagram is relatively straightforward for a team that understands the syntax. However, designing a programme around it, facilitating workshops, working through patterns across cases and distilling them down to actionable KRIs is not nearly as simple and takes a far bigger commitment of resources than most internal risk teams would have capacity for, given their limited bandwidth and the full range of their responsibilities.
Paragon Consulting Partners is here to help you establish a robust risk management framework and get the most value out of your bow tie diagrams, using our own expertise and experience.
We provide a range of services:
- Facilitating multi-disciplinary bow tie analysis workshops
- Comparing and contrasting scenarios to identify risk drivers and control gaps
- Defining key risk indicators from bow tie analysis aligned to key risk drivers
- Reviewing existing control frameworks and testing for coverage of risks identified
- Training risk and operational management teams in bow tie analysis
- Applying positive bow tie analysis across projects or programmes as a means of capturing best practices for consistent good results in the future
Request a consultation today to start mapping your organisation’s key risk drivers.